Frequently Asked Questions
Density Web Application
Tracking Square Footage per Person
Many companies are using square foot per person as a metric to support their safe return to work strategies.
You can create customized reports in Dashboard to track this metric over time per space or a rollup of multiple spaces.
To set up this report, you must first input your square footage of your space(s). To do this:
Login to dashboard.density.io
On the left side, select the desired space
At the top right, click the wheel icon to Manage Space
Click Edit
Inside the Meta section, input the square feet in the Size field.
Optional: You can also enter the Target Capacity of the space to track utilization and Annual Rent to track available capacity
Click Save when finished
To set up this report, you must first input your square footage of your space(s). To do this:
- Login to dashboard.density.io
- On the left side, select the desired space
- At the top right, click the wheel icon to Manage Space
- Click Edit
- Inside the Meta section, input the square feet in the Size field.
- Optional: You can also enter the Target Capacity of the space to track utilization and Annual Rent to track available capacity
- Click Save when finished
To create the square foot per person report:
- At the top left, click Dashboards
- Click the Dashboard name to see a dropdown of already created Dashboards and select the relevant Dashboard or you can click the Add a dashboard button in that same menu
- At the top right, click Edit dashboard
- Click Create new report
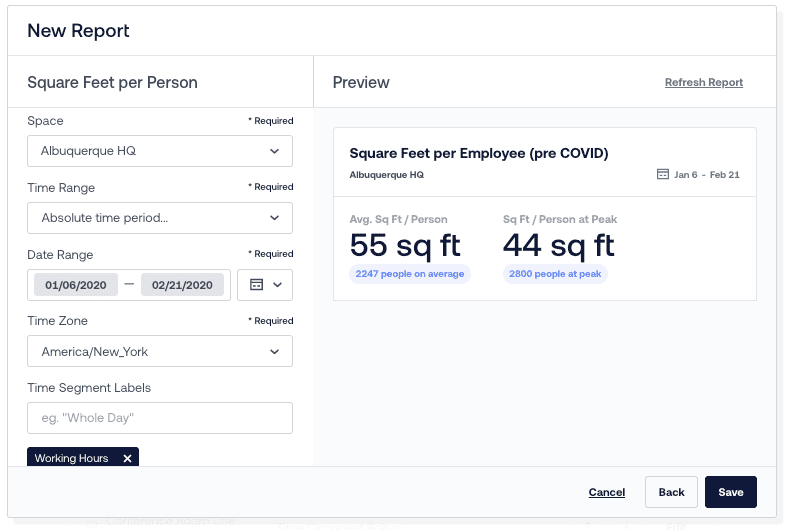
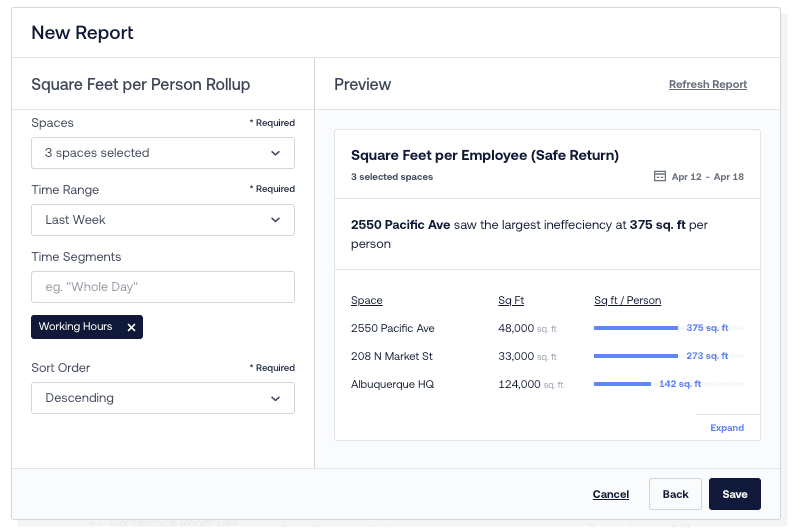
- In the search bar, enter “square” and depending on whether you want to track a singular space or compare multiple spaces, select either the Square Feet per Person or Square Feet per Person Rollup report then click Next
- Once you have filled out all the fields, click Save*
- At the top right corner click Save to save the report to your Dashboard
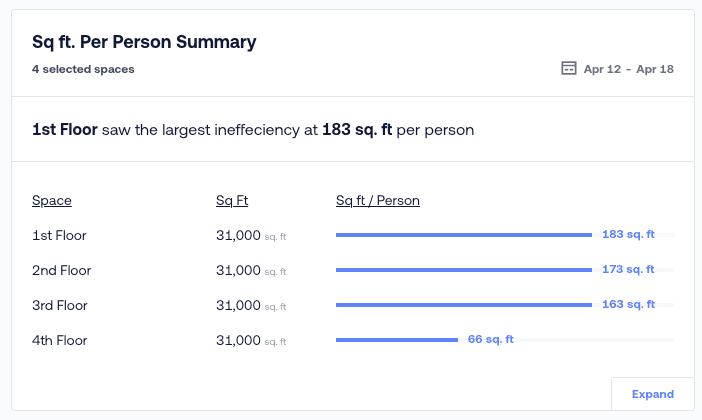
*The empty fields is where you can customize your report. We recommend creating this report twice with two different time ranges:
- To create a historical baseline, under Time Range select Absolute time period and choose the date your space reopened from Winter holiday until the 2nd or 3rd week of February depending on when COVID started to impact attendance (this is typically a couple of days or a week before there was a Shelter in Place mandate)
- Create another report, but with a time range that is ongoing. We recommend selecting Last Week to support weekly reporting and to see trend over time.
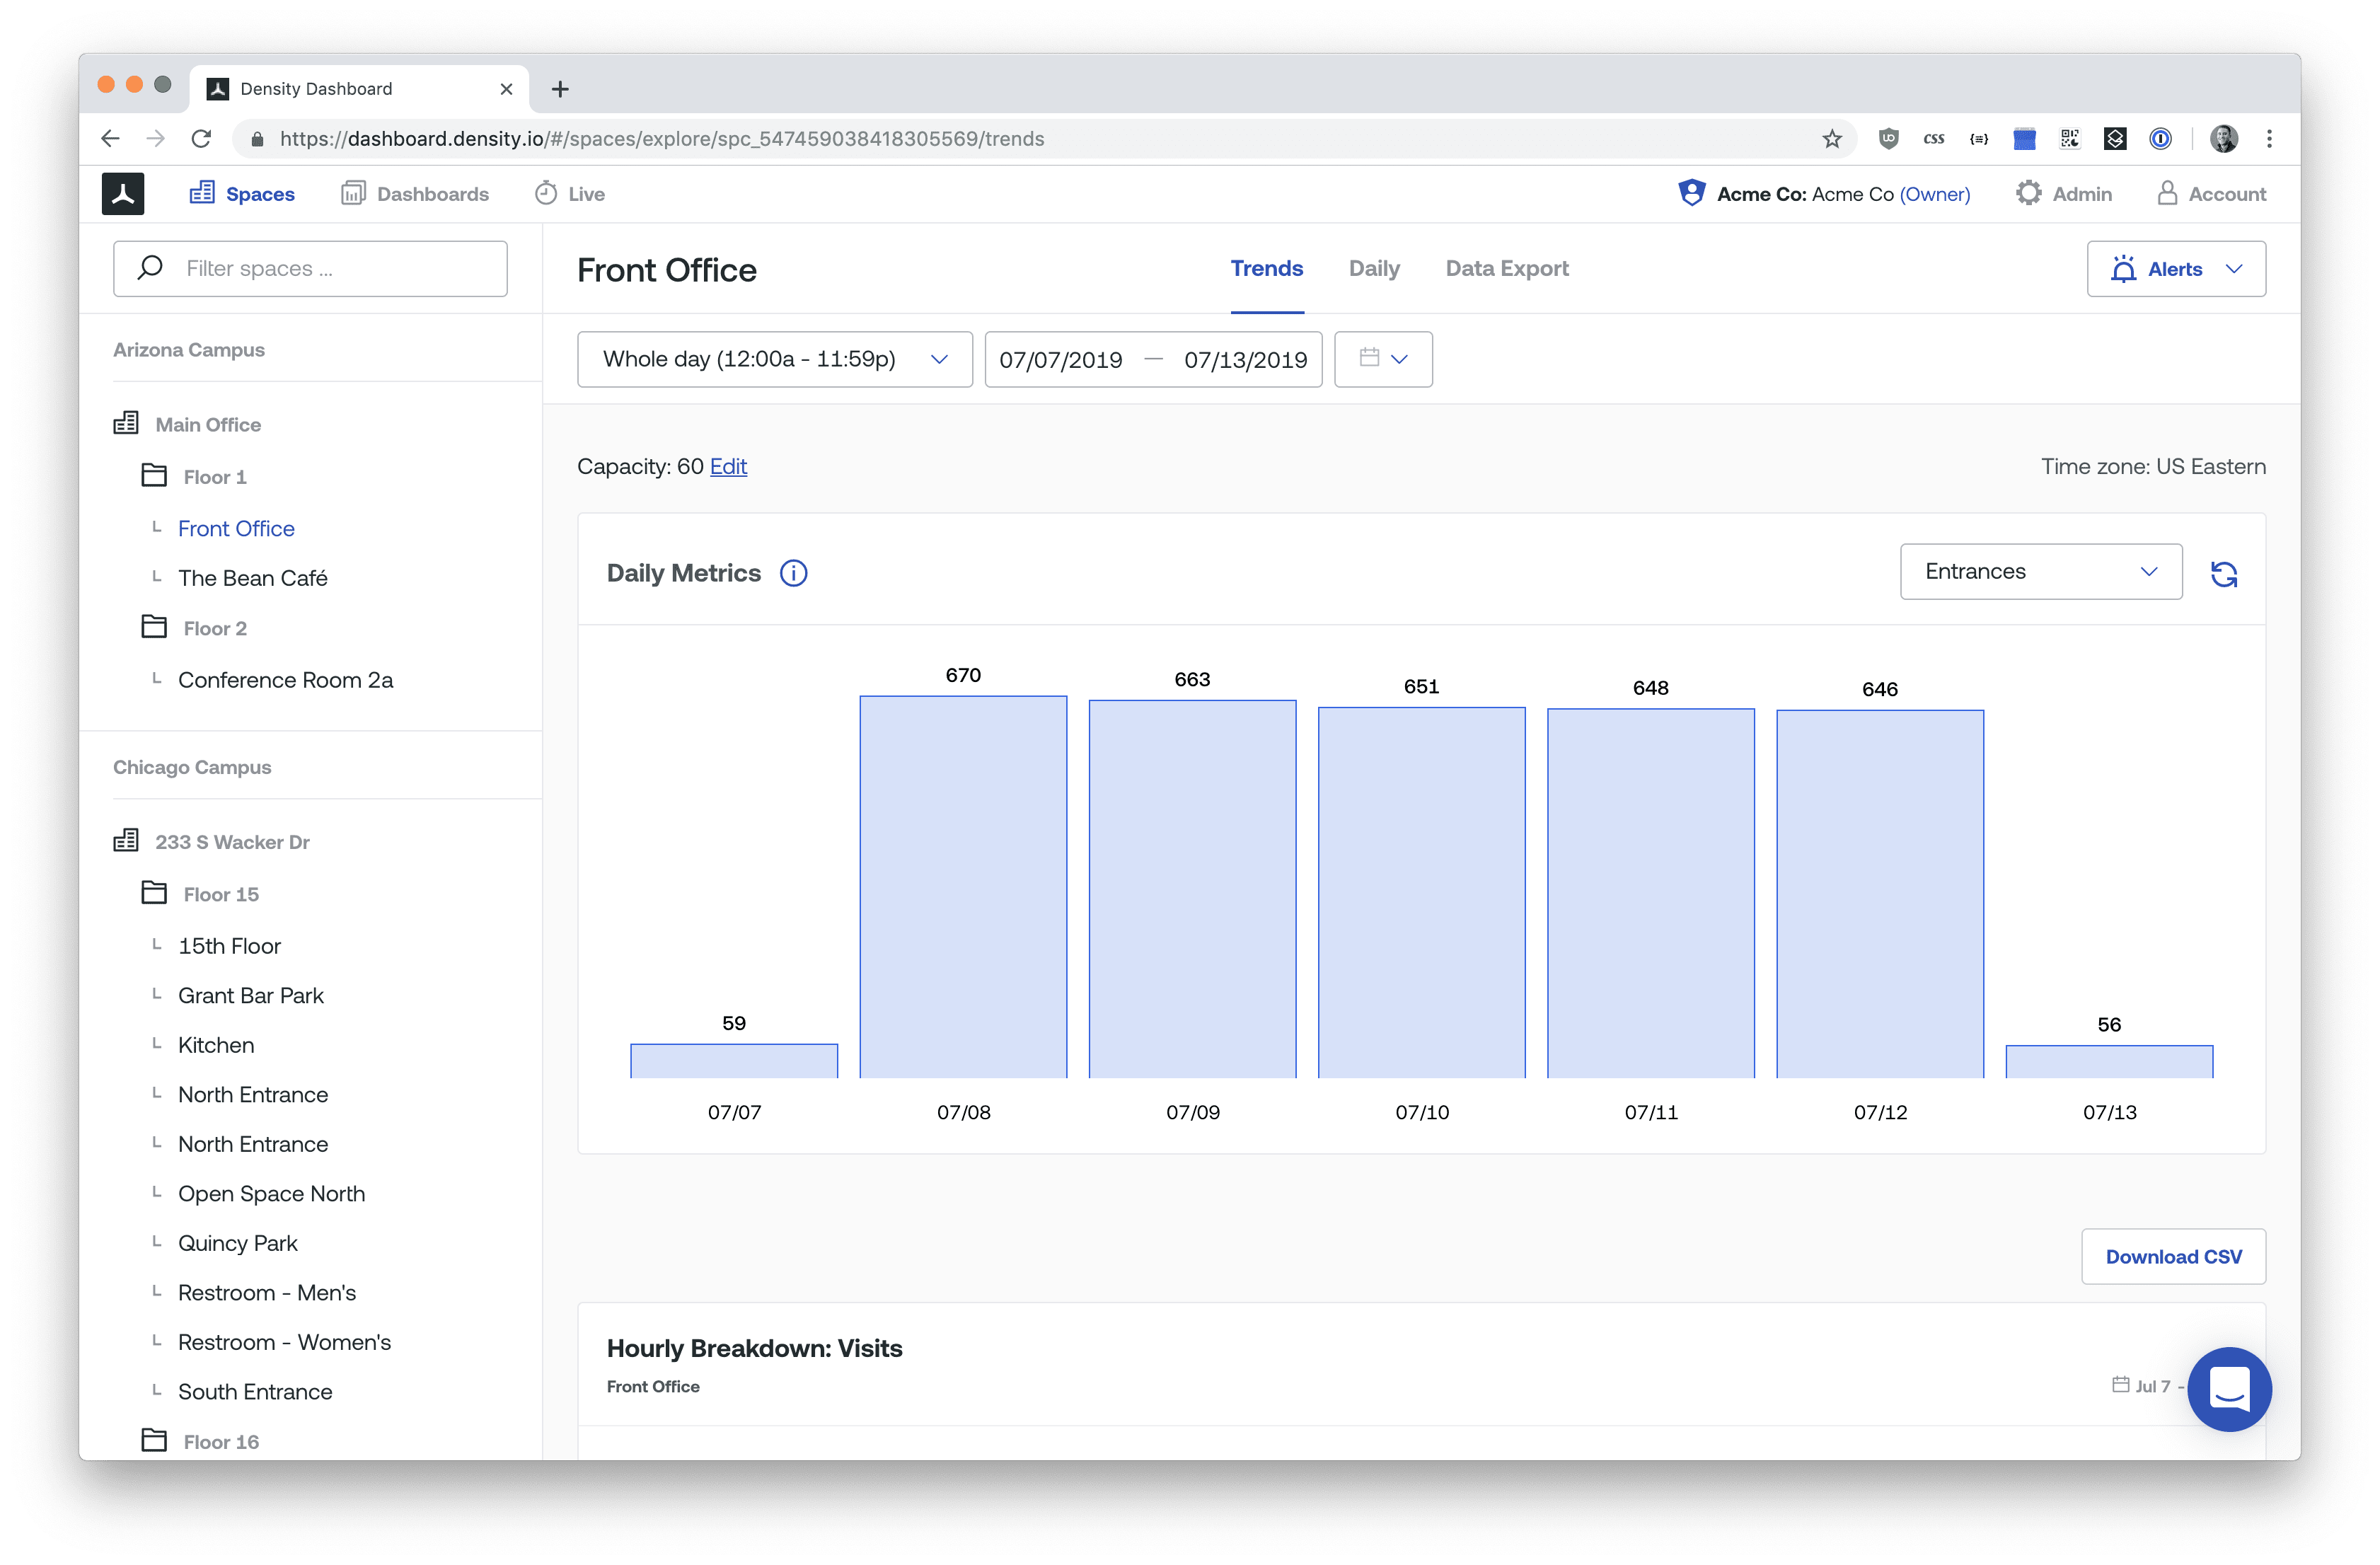
How to set up Alerts
There are many reasons to set up alerts for your spaces. You may want to know if your space is getting close to its legal capacity or if it is becoming less busy in order to send cleaning staff to tend to it.
Especially during and after COVID-19 it is increasingly important to be know in real-time when your space reaches a certain density level.
There are two ways to receive alerts: SMS or push notifications.
SMS
To set up an SMS alert to be sent to your phone, follow the below steps.
Note: To set up alerts yourself, you must have either Admin or Owner permissions. You can set up alerts for team members that do not have a Density login or enough permissions.- Login to dashoboard
- In the Spaces tab, select your desired space
- At the top right, click Alerts
- In the drop down menu, select Add an alert
- Enter the mobile number you wish to receive the SMS alert — Note: click the country flag to change the country code
- In the drop down menu, select with Greater than or Less than depending on whether you want to be alerted of a maximum or minimum occupancy
- Enter the number of max or min amount of people
- In the Notify me at most drop down menu select at what frequency you wish to receive the alert
- Click Save when you want to set the alert live
Push Notification
To set up a push notification, follow the below steps.
Note: To set up push notifications, you must have either Admin or Owner permissions.- Open the blue Density Mobile app (iOS or Android)
- Login with your same credentials that you use to login to the Density dashboard.
- At the top of app, tap on the space name to see all spaces in your portfolio.
- Tap the desired space.
- At the top right, tap the bell icon. This will swipe to a new screen.
- At the top right tap the “+” icon.
- Tap the first Select an item.. field to select whether you want to be notified if occupancy gets to be above or below a specific threshold.
- In the people field, enter the occupancy number
- Tap the second Select an item… to select how often you would like to receive push notifications if the event occurs.
- Optional: Tap Advanced Settings if you want to get a 2nd notification if level of occupancy increases by a certain number of people.
- In the lower right corner tap Save to set up the push notification alert.
The Dashboard is blank, what do I do?
To start getting the most out your sensor, we recommend creating reports to surface insights.
You can create reports either in Dashboards or Analytics sections found at the top left of the Density platform.
Most of the reporting in Dashboard and Analytics rely on multiple days, weeks, or months of data before they start providing insights. We recommend creating Dashboard(s) with the reports you want and inviting your team to the platform to get acquainted. After 1 week most reports should start rendering insights.
You can always look at the live traffic by visiting the Live section of the Dashboard.
How to login to Density Dashboard
When the Density sensors were shipped, the purchaser should have received an email from Density prompting you to accept an invite from Density to create your account.
If you cannot locate the email, please contact support.
You can access the Dashboard at https://dashboard.density.io
Exporting your data in CSV format
It’s easy to get Density data in CSV format. You can follow this process to get data from any space.
Head to your Spaces page by clicking “Spaces” in the navbar and select the space you are interested in from the left-hand menu.
Head to the Data Export tab and select the date range.
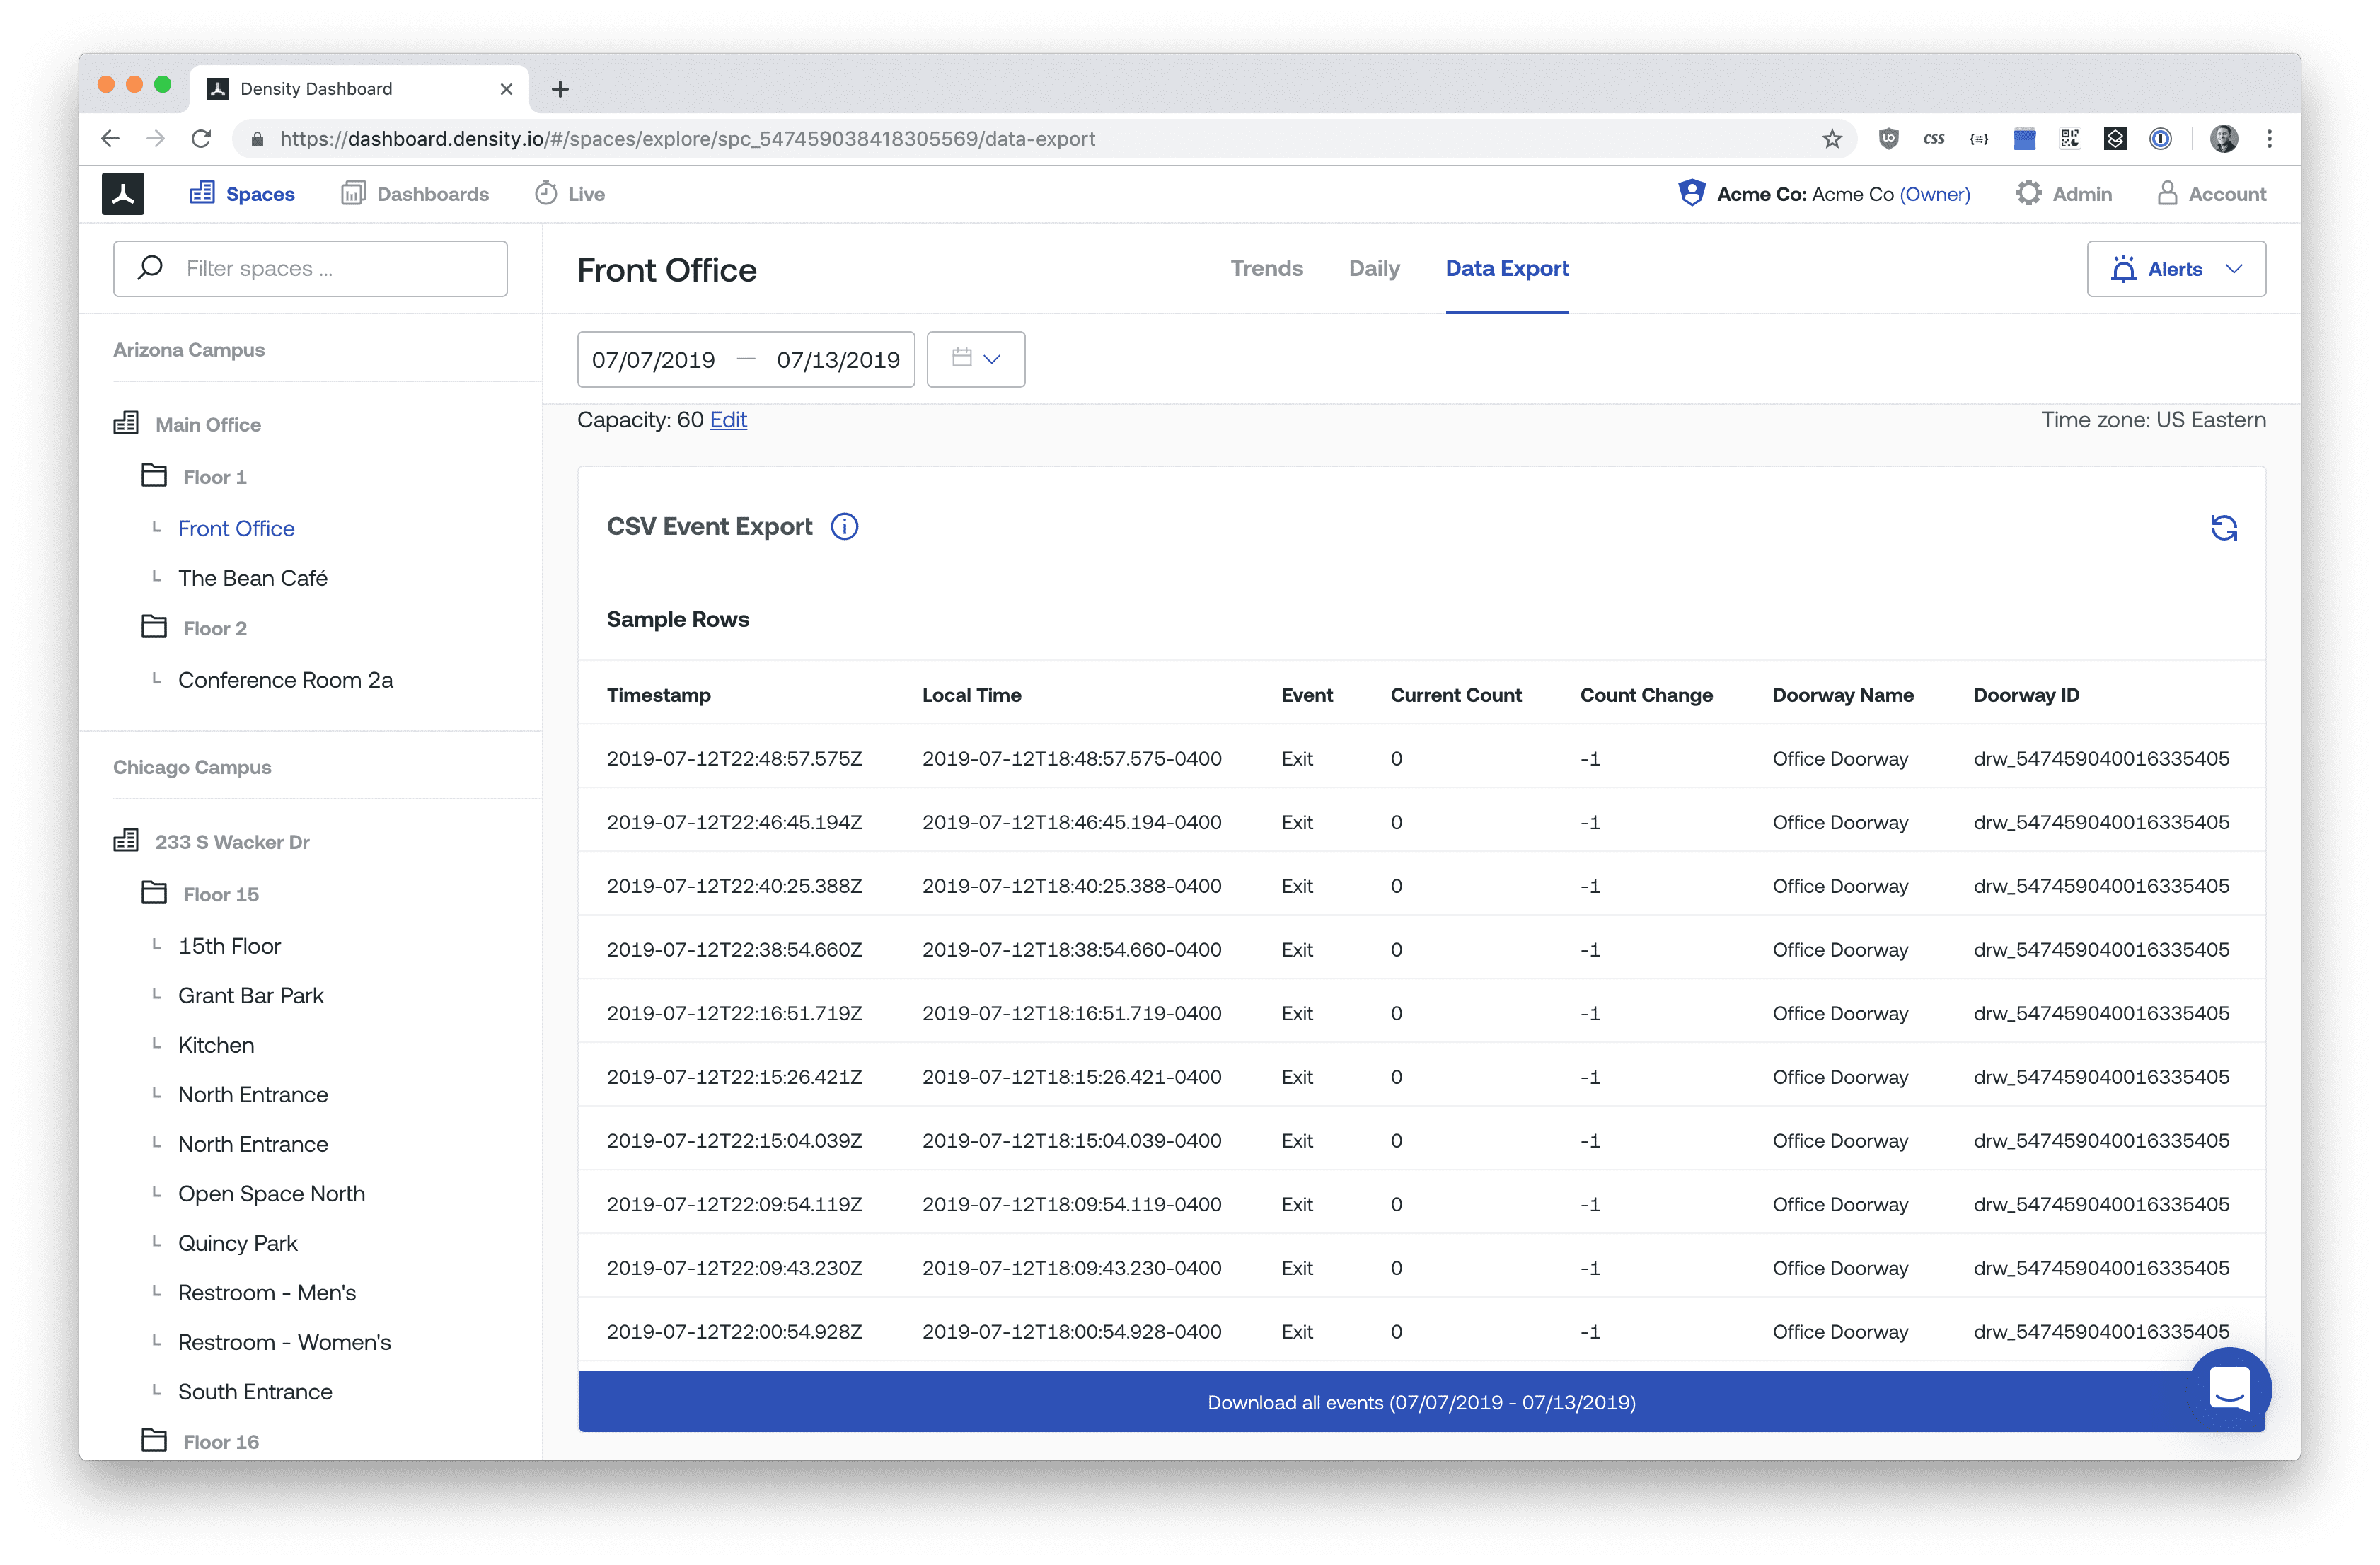
Once you have the data from the range you’re looking for, hit the blue “Download all events” button and a CSV file will be downloaded to your computer.
Adding Team Members to Email Digests
Adding team members to email digests is easy.
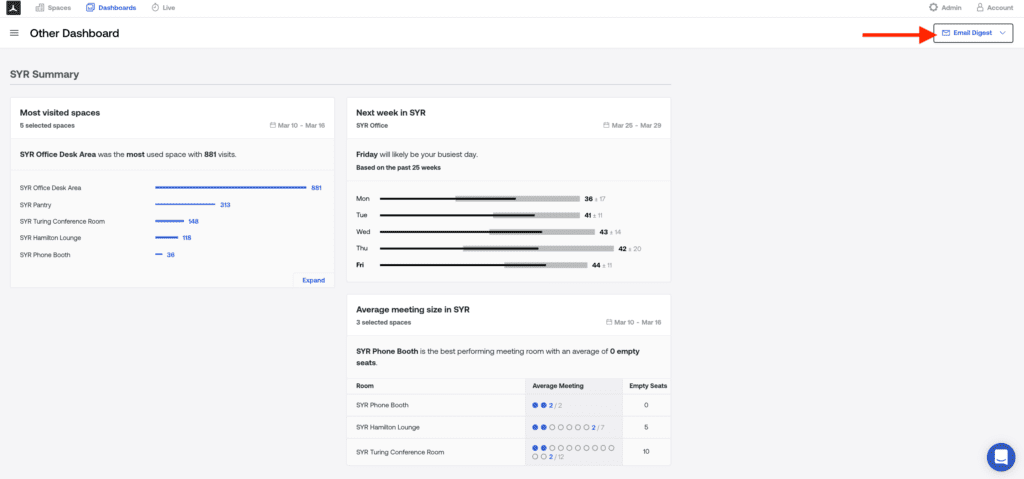
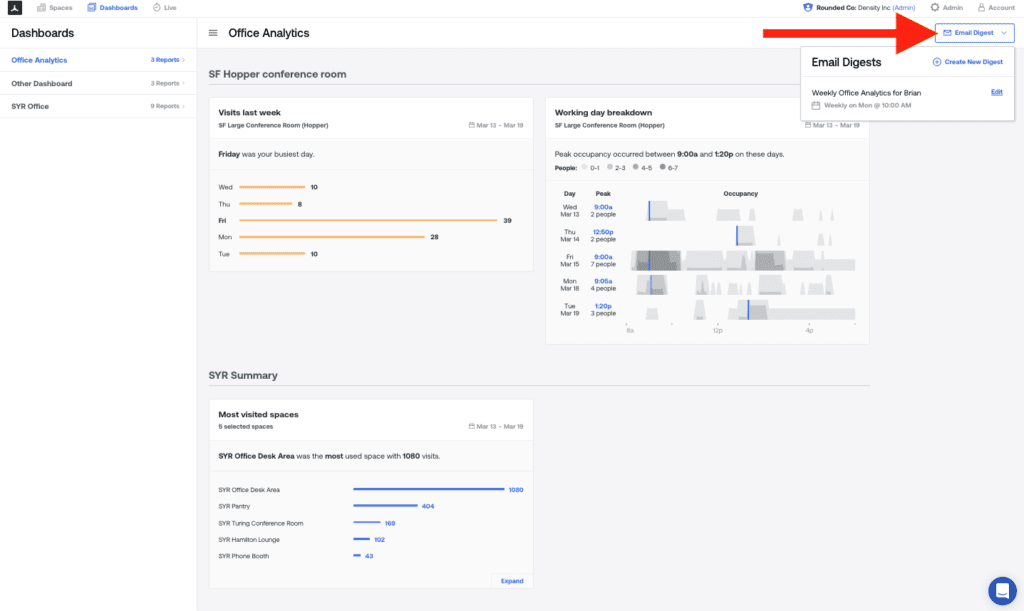
Head to the dashboards page, find the dashboard you’d like to share, and click Email Digests at the top right corner.

Look for the specific Email Digest you would like to update and click edit. Now you can search for your team member and them to the list. Finally, click “Save.”

Note: If your team member doesn’t have a Density account, you will be prompted to create one for them.
You’re all set. The next time this Digest goes out, your new team member will receive it.
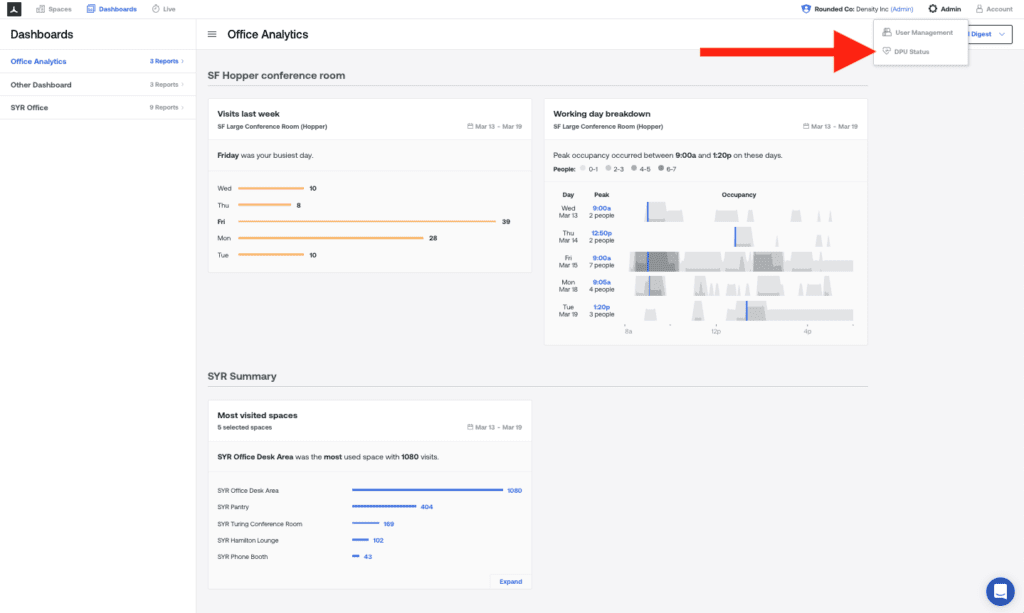
How to check device status
To see the status of your DPU devices:
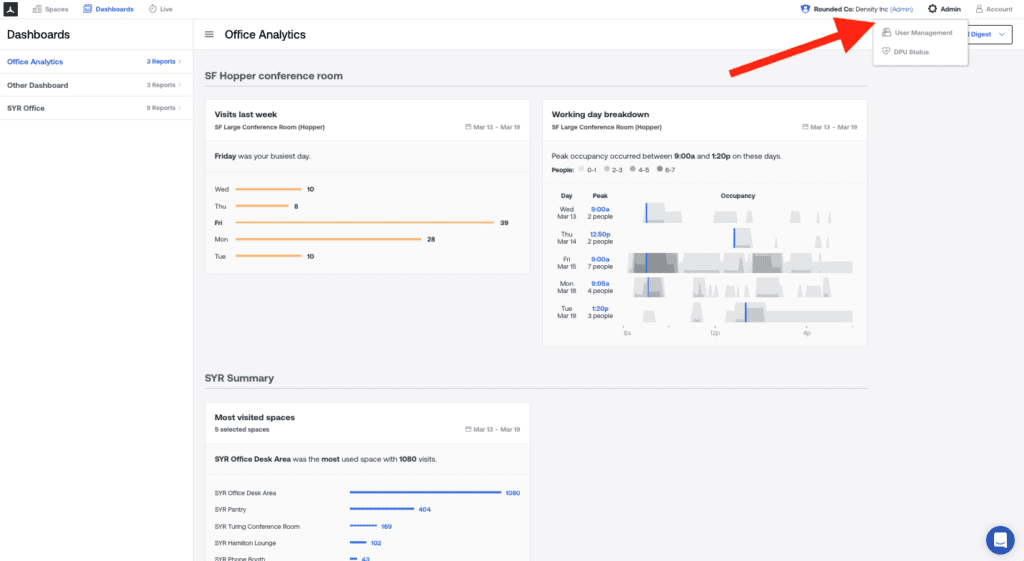
(1) Under the Admin dropdown, select “DPU Status.”
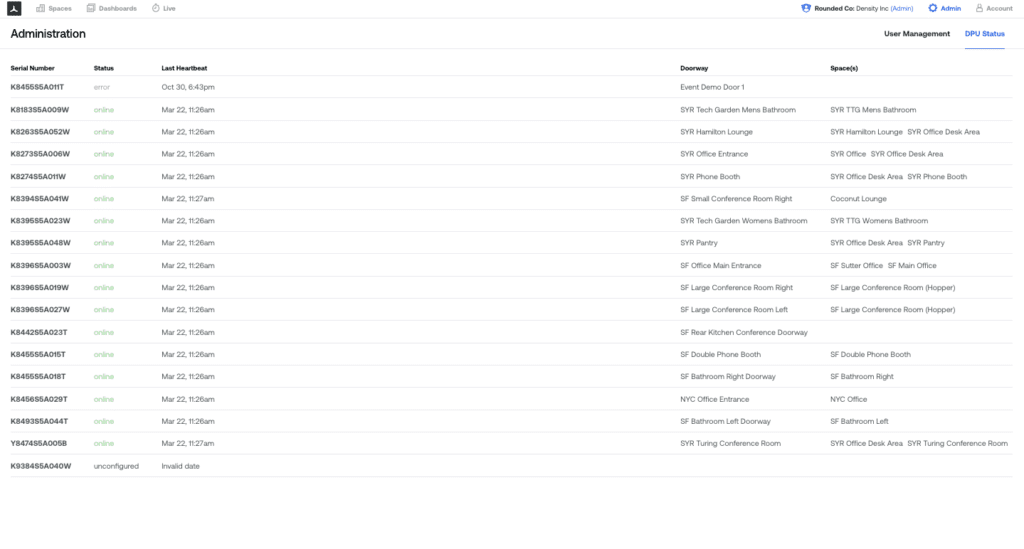
Definitions
Status:
- Online: Device is connected and operational
- Offline/Error: Device is not connected or is unable to connect to the network
- Unconfigured: Device is not set up
Last Heartbeat: the last time when the DPU communicated with Density’s cloud service
Doorway: the user-defined name of the doorway where the DPU is installed
Space(s): the room or space where the DPU is installed
How to create an email report
Dashboard offers users the ability to send an email report of any dashboard you’ve created. These reports can be configured to be sent daily, weekly or monthly.
To create a new email report
(1) Click on Dashboards in the top menu to open up all created dashboards for your organization. Click Email Digest.
(2) Click “Create New Digest” on the dropdown under Email Digests.
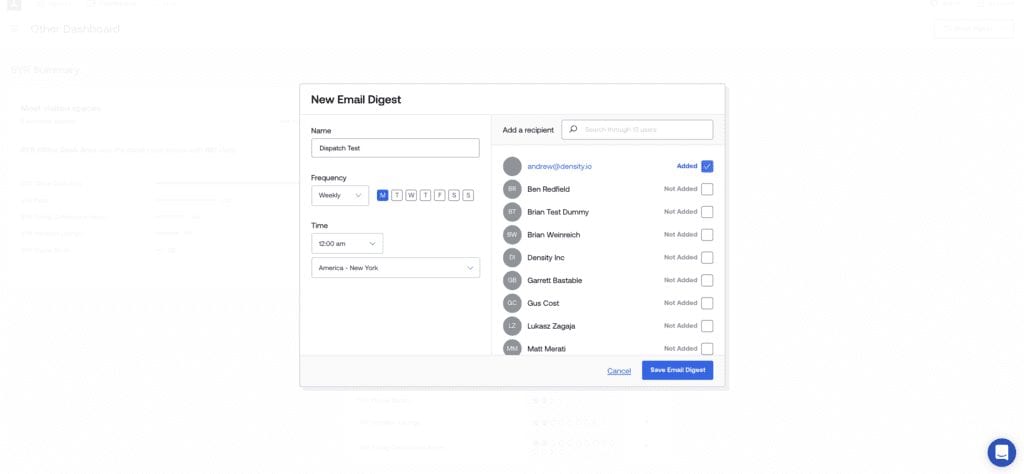
(3) Add a Name for your Email Digest and select a delivery frequency (Daily, Weekly, Monthly) and a time to deliver the report. Once the settings are in place, choose which users you would like to receive the report.
How to add & manage users in Dashboard
In the Density Dashboard, you can add and manage users in your organization. Users can have one of the following user profiles:
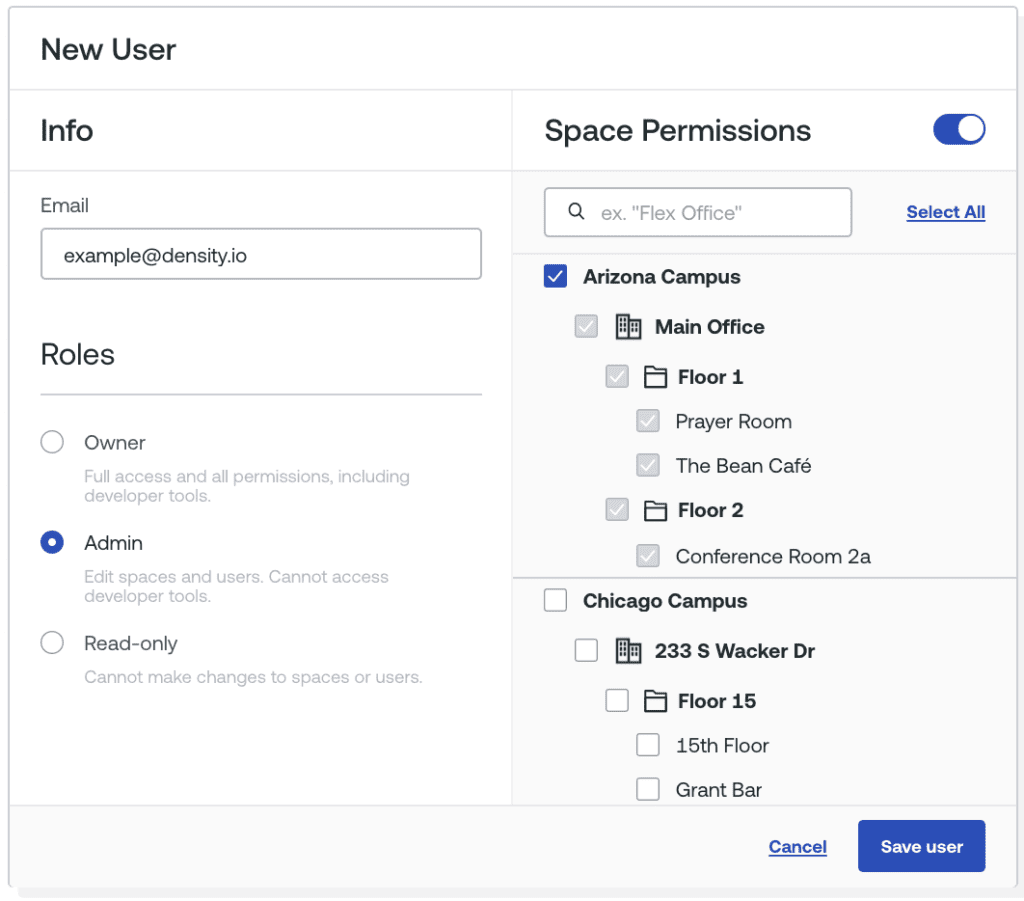
- Owner: Full edit rights for spaces, names, and users. Full access to development tools.
- Admin: Can edit spaces and names to the spaces they have access to. Can’t access development tools.
- Read-Only: Can’t edit any spaces or names; can only see data for spaces to which they’ve been assigned. They also can’t create alerts or email digests.
To add a new user
(1) Navigate to the Admin field in the top right menu and select User Management in the drop down.
(2) Once you are on the User Management page and see all your users, select Add User.
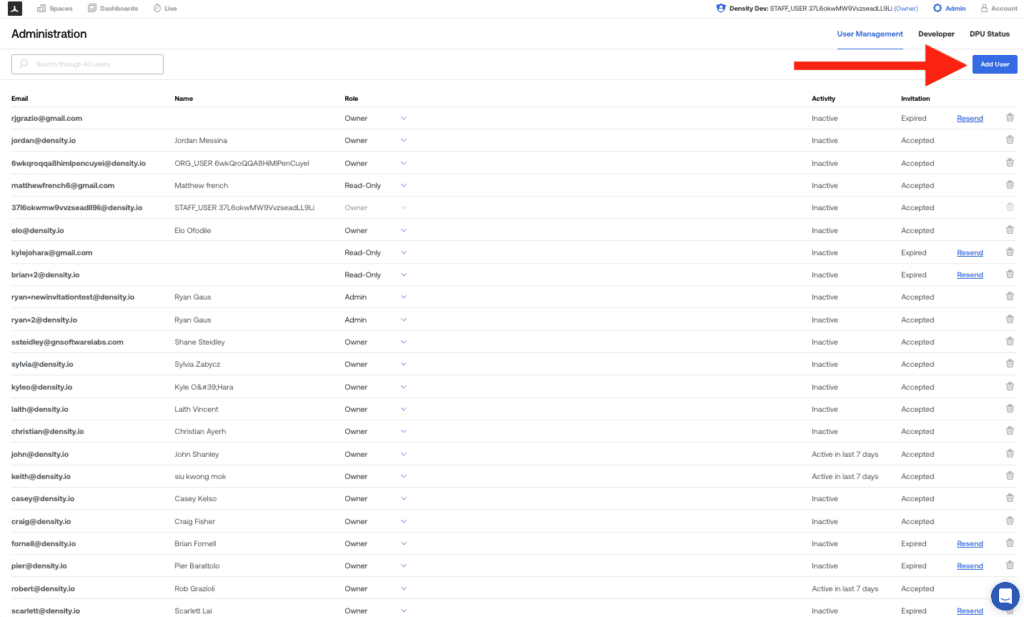
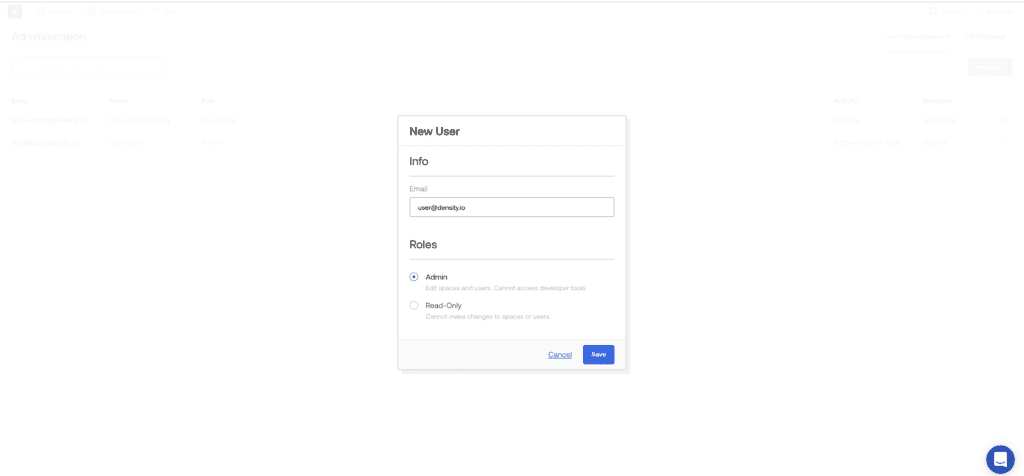
(3) Enter the user’s email address and select the user profile type (Owner, Admin or Read Only). Click save and an account activation email will be sent to that user.
(4) You can use the “Space Permissions” option to limit the locations that Admin or Read-Only Level Users have access to (example below).
How real-time are the results?
Density processes in depth data in near real-time, generating results in under a second (~700 milliseconds). All count data is processed locally on the device. You can then access the data via API and in Dashboard in near-real time — typically in under a second, though depending on network availability and other variables, Dashboard data is available in around 5 seconds.
How to create a doorway in Dashboard
How to Create a a Doorway
Step-by-step instructions are below:- Login to dashboard.density.io
- At the top right, click Admin.
- Select Locations in the drop-down.
- At the top right, click Add a building.
- In the Name field, enter a name for your building (all fields can be edited later if needed).
- OPTIONAL: You can select a space function, upload a photo, and enter an Address but it is not required.
- Scroll to Doorways and click Add a new doorway.
- A pop-up window titled New doorway appears.
- In the Name field, enter the name of a doorway you want to assign to a sensor.
- Select if the sensor is inside or outside the space. Note: You determine its location by determining if the sensor is located in the space you want to collect data for or if it is on the other side of the doorway (outside the space).
- OPTIONAL: You can add in the height of your sensor to the floor and the width of the doorway. This is helpful to double check if you installed correctly based on the requirements in the Install Doc and allows our support team to more quickly help with troubleshooting.
- Select either Yes or No to determine if your sensor might need to be installed differently based on the how much mounting space there is. Note: This is helpful for customers who have not installed a sensor yet.
- Under Power option select how the sensor will be powered.
- OPTIONAL: You can upload a photo of the installation. This will help you if you are unsure which doorway name represents the actual doorway. It also helps our support team in case you have questions about your installation.
- Once complete, click Save doorway to save the doorway to the building you just created.
- Confirm that the doorway you just created is selected under the Doorways section.
- At the top right, click Save after you have created all doorways of the building.